Part of the series: Logging and Debugging High Throughput Services
You can get by with log files. Supporting our payment gateway product we did that for years. But as the transaction volume grew, so too did the log volume. We added servers to accommodate the load and new services to drive functionality. Each time it got harder and harder to sort through the mess. Then one fall we had a massive outage. One of our SQL databases died and that caused a massive ripple effect throughout the system. Our virtual levees broke one-by-one until we were hard down. That exposed some client bugs and, shockingly, we lost data. That data represented our customer’s money so they were pretty angry. From what I hear, we wrote checks to make them happy again.
Anyway, the aftermath was wild. Lots of finger-pointing and a lot of painful log analysis. Some guys tried to build parsers to reconstruct things from our logs but it didn’t lead to much.
During that fiasco, there was a lot of talk about how to improve things. We started converting our logs to use structured logging and added a correlation identifier so we could track messages throughout the system. The next big step was to bring in Splunk which is a software product for doing log aggregation and analysis.
The features Splunk gave us were game-changing. We used it to do support, of course. If customers had issues, it was our go-to to figure out what was going on. But that was just the tip of the iceberg. We built dashboards on top of the data. Alerts & monitoring. My personal favorite thing to do was use it for API analysis. I could see which customers were using different versions, different fields, cryptography methods, whatever. It was great. I have nothing bad to say about Splunk. So what’s the catch? From what I hear, it was very expensive. Like $500k-a-year expensive. Pretty much as soon as we put it in, the suits started asking us to find a cheaper solution. So if you have the cash, I recommend it. If not, what I’m going to cover here is the ELK stack. ELK stands for: Elasticsearch (DB + search engine), Logstash (colletor), & Kibana (UI). We’re really going to use Filebeat instead of Logstash, but the acronym is catchy. My personal experience with ELK stack has also been great. I haven’t run into anything I can’t do in Kibana that I previously used Splunk for. It’s free as far as licensing goes, but you need to run it somewhere.
ELK Configuration
I’m going to do this using Docker for Windows (Docker Desktop). If you’re not yet using Docker, shame on you! At the very least it is great for messing around with things and doing development work. I’ve used it lately to build against Redis, Zipkin, Jaeger UI, HashiCorp Vault, & Kafka. In every case, it has worked great.
First let’s create a network. We’re going to run two containers and they need to communicate.
# Add a network for containers to communicate
docker network create elk-net
Next we need to spin up our ELK. I used this as a guide. My docker-fu is still weak but luckily it isn’t too hard to do spin up simple things for R&D.
# Start up ELK Container
# "elk-net" network added.
docker pull sebp/elk
docker run -p 5601:5601 -p 9200:9200 -p 5044:5044 -it -d --name elk --network=elk-net sebp/elk
After you do that you should be able to navigate to http://localhost:5601 and bring up Kibana. How easy was that?
Filebeat is going to be slightly more work, mainly because we need to configure our log sources. This guide was pretty good, but I had to google around to get all the way there.
First create a configuration file named filebeat.yml:
filebeat.inputs:
- type: log
  paths:
  - '/var/logs/*.log'
  json.message_key: Content
  json.keys_under_root: true
  json.add_error_key: true
  processors:
  - add_docker_metadata: ~
output.elasticsearch:
  hosts: ["elk:9200"]
What you need to put in there is going to depend largely on your log data. If you want to consume the log files written by Macross.Logging.Files, that should get the job done. Those files are JSON-based and end in the .log file extension by default. What Filebeat is going to do for us is monitor the /var/logs/ folder and pump our log messages into Elasticsearch, parsing the JSON and promoting things to fields along the way.
When we start up the Filebeat container we have to do some work to mount our config file & our log directory as volumes, and set up our network:
# Start up Filebeat container
# Map config file & log directory
# "elk-net" network added.
docker pull docker.elastic.co/beats/filebeat:7.7.0
docker run -v C:\Users\blanch\Desktop\filebeat\filebeat.yml:/usr/share/filebeat/filebeat.yml -v C:\_Dev\Demo\Logs\:/var/logs/ -d --name filebeat --network=elk-net docker.elastic.co/beats/filebeat:7.7.0
Mind the two file paths. The left side of the first volume mount is the path to my filebeat.yml on my actual system. The left side of the second volume mount is the path to the logs I want to push into Kibana, also on my actual system. You will need to update those.
Let that run for a minute and then refresh Kibana. On the discover page you should see something telling you to set up an index pattern:

I put filebeat-* as my index pattern. I think what that will do is put all our Filebeat data into one index. It seems to work fine, but, I’m going to level with you guys here, I’ve never actually set this stuff up before. I’ve always had IT or DevOps support to help with that. So in a way, we’re all learning together on this one! If you happen to know a better practice, by all means, please drop a comment so I can pass it on to future readers. In the payment gateway Splunk we had two or three indexes, representing our major customer environments. In Kibana we have a ton of indexes.

The next thing we have to do is tell Kibana what field to use for the timestamp. I picked @timestamp which I’m pretty sure is when Filebeat sent it to Elasticsearch (ingest timestamp). You might prefer using the timestamp from the logged JSON instead. That is possible, of course, you just have to do some configuration to make it happen. Here’s one possible way to make that work.
Search your log data using Kibana
Once you have set up your index pattern, we should have some data to play with. Let’s see if we can query our log data for all the times the application started:
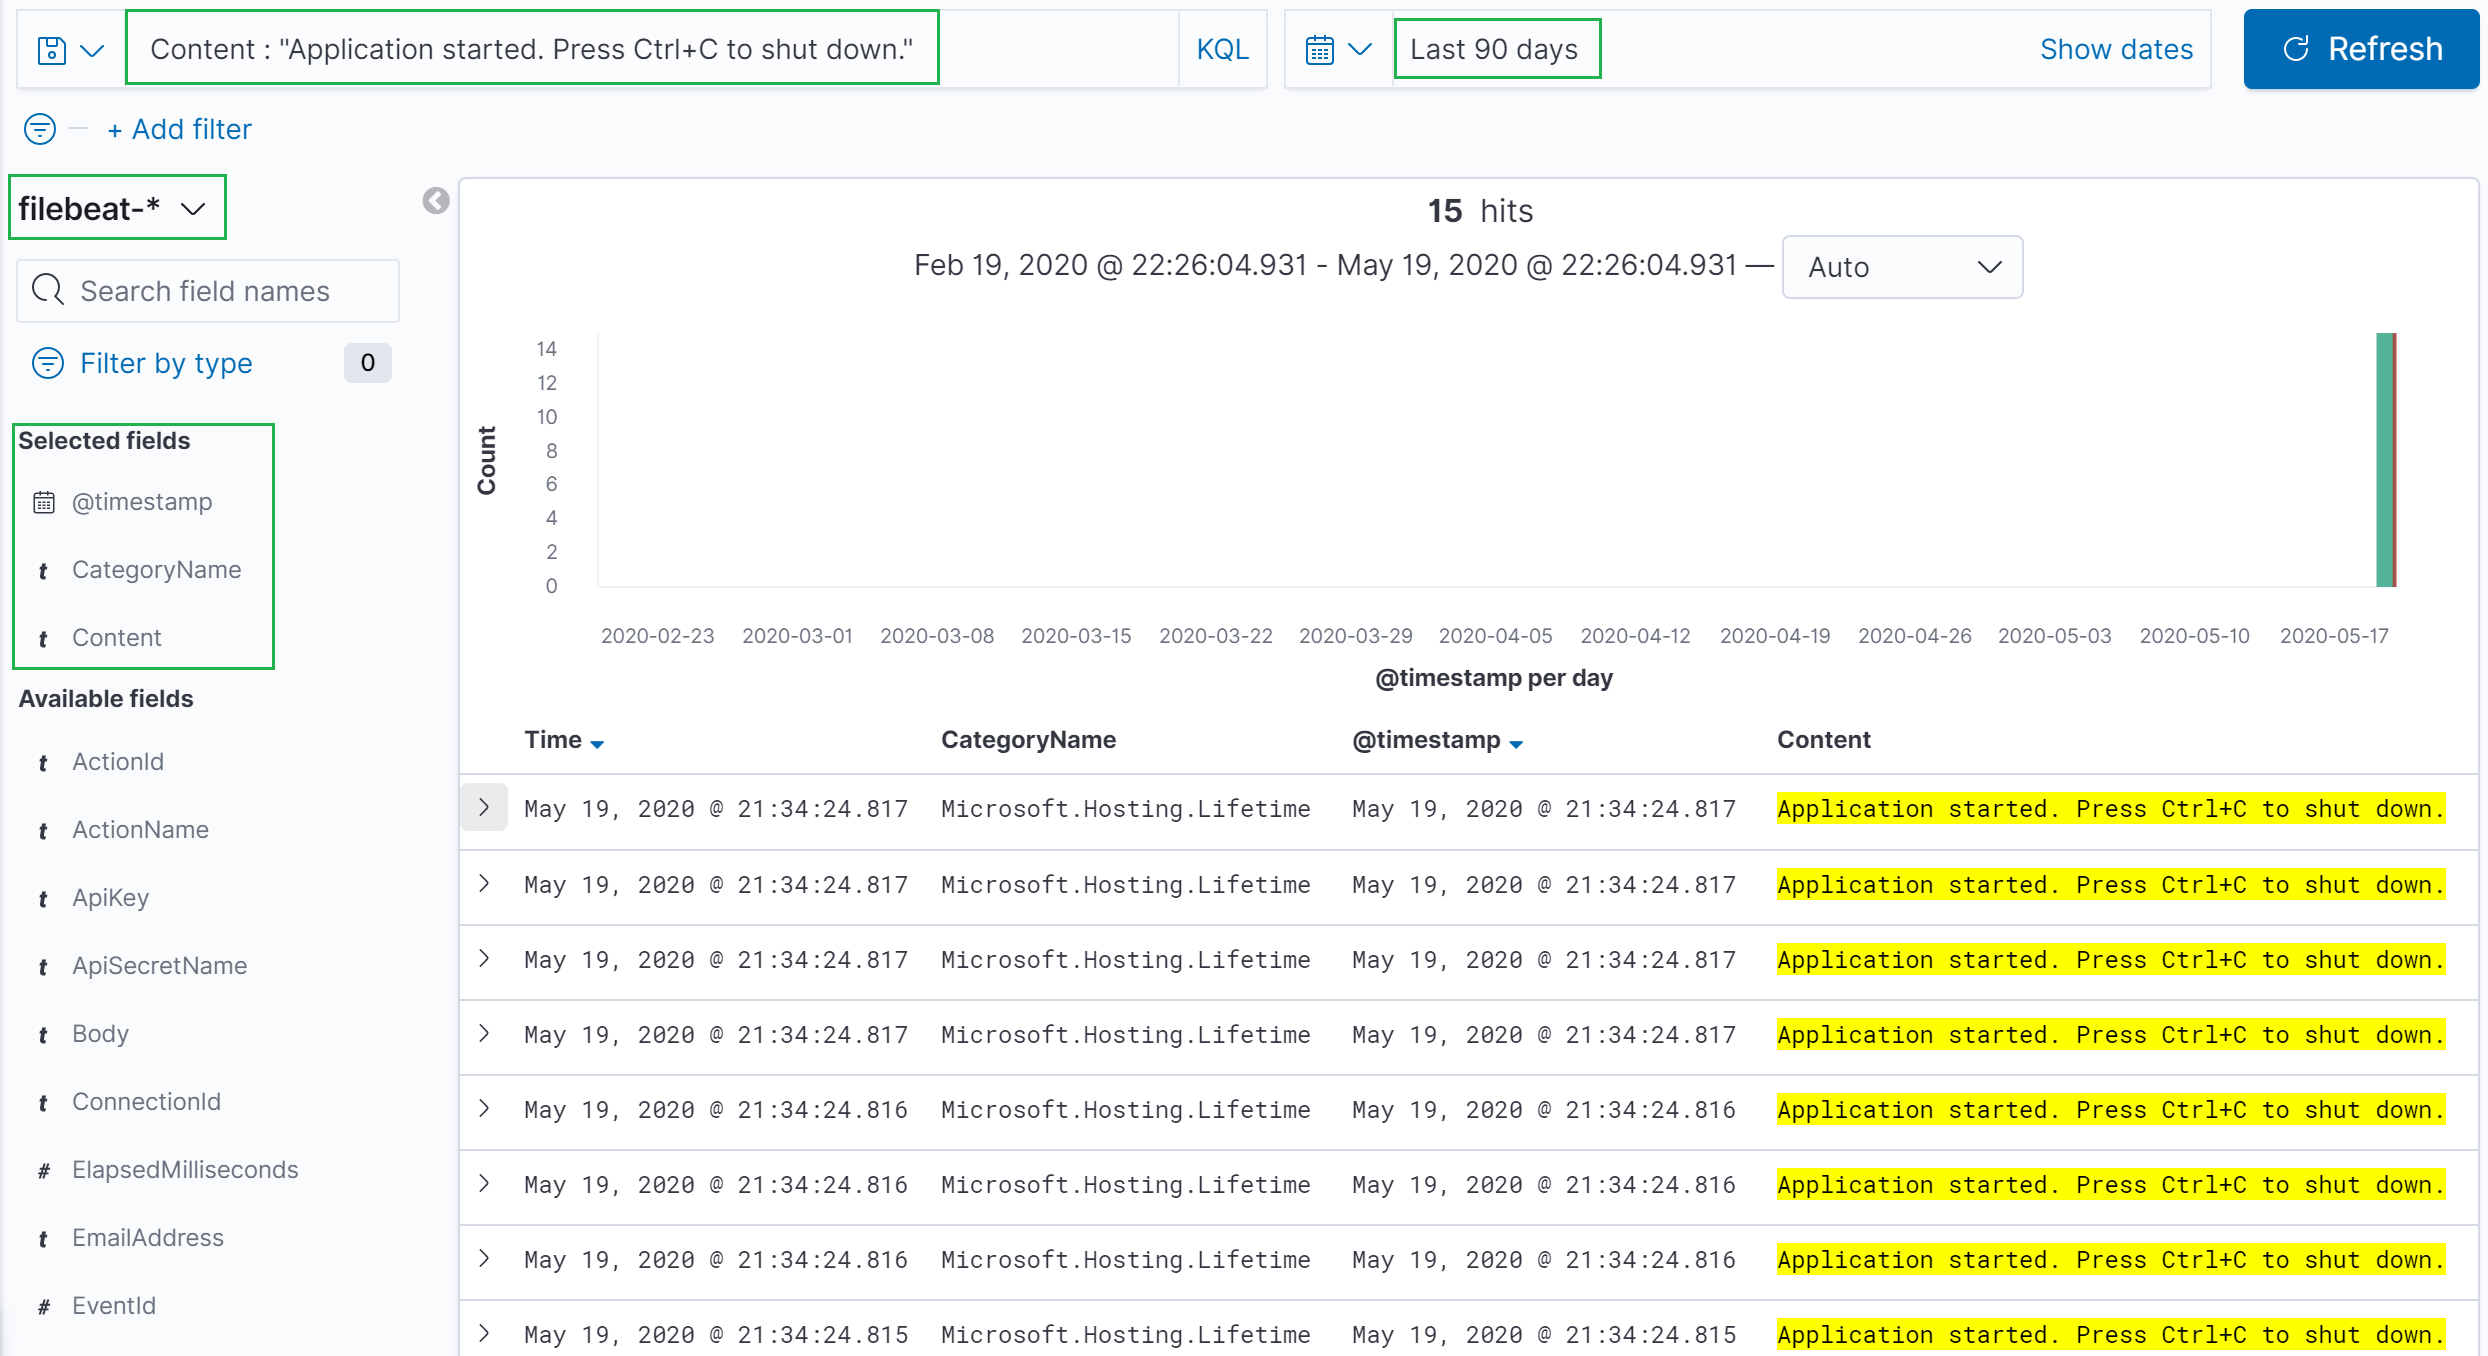
There’s a lot going on in the UI so I made some highlights in green.
- The query:
Content : "Application started. Press Ctrl+C to shut down."- I knew exactly what I was looking for so that is kind of cheating. Typically you know some area of code you are interested in so you can do something like
CategoryName : "Microsoft.Hosting.Lifetime"and then start zeroing in on what you want.
- I knew exactly what I was looking for so that is kind of cheating. Typically you know some area of code you are interested in so you can do something like
- The index is below the query to the left. It’s easy to miss! If you aren’t finding anything, remember to ask yourself: Am I in the correct index? I make that mistake all the time.
- Right below the index you can see some fields I selected. I did that more because there was some stuff in my messages I didn’t want you guys to see. Sorry! But it’s also a great demo of how our JSON fields are automatically picked up and we can work with them without having to define anything.
- In the top-right (ish) we can see date selection. That’s important, obviously.
So there you go. You can now query your log data and put it to work.
Here’s a more “killer demo” that will also tie into the next post. Last time we talked about how to correlate our logs across applications by putting an ID on all the messages. You have different ways to get to a specific ID. In my APIs, I return it on all responses. Then I train the customers to provide that any time they need support. If you have the ID, it’s a simple query to turn up the messaging. If you don’t, you have to dig a bit. Start with what you know. An area of code, an exception message, a hunch, whatever. Eventually, you will get to some set of messages and then you can pull their IDs and look at what happened for each request.
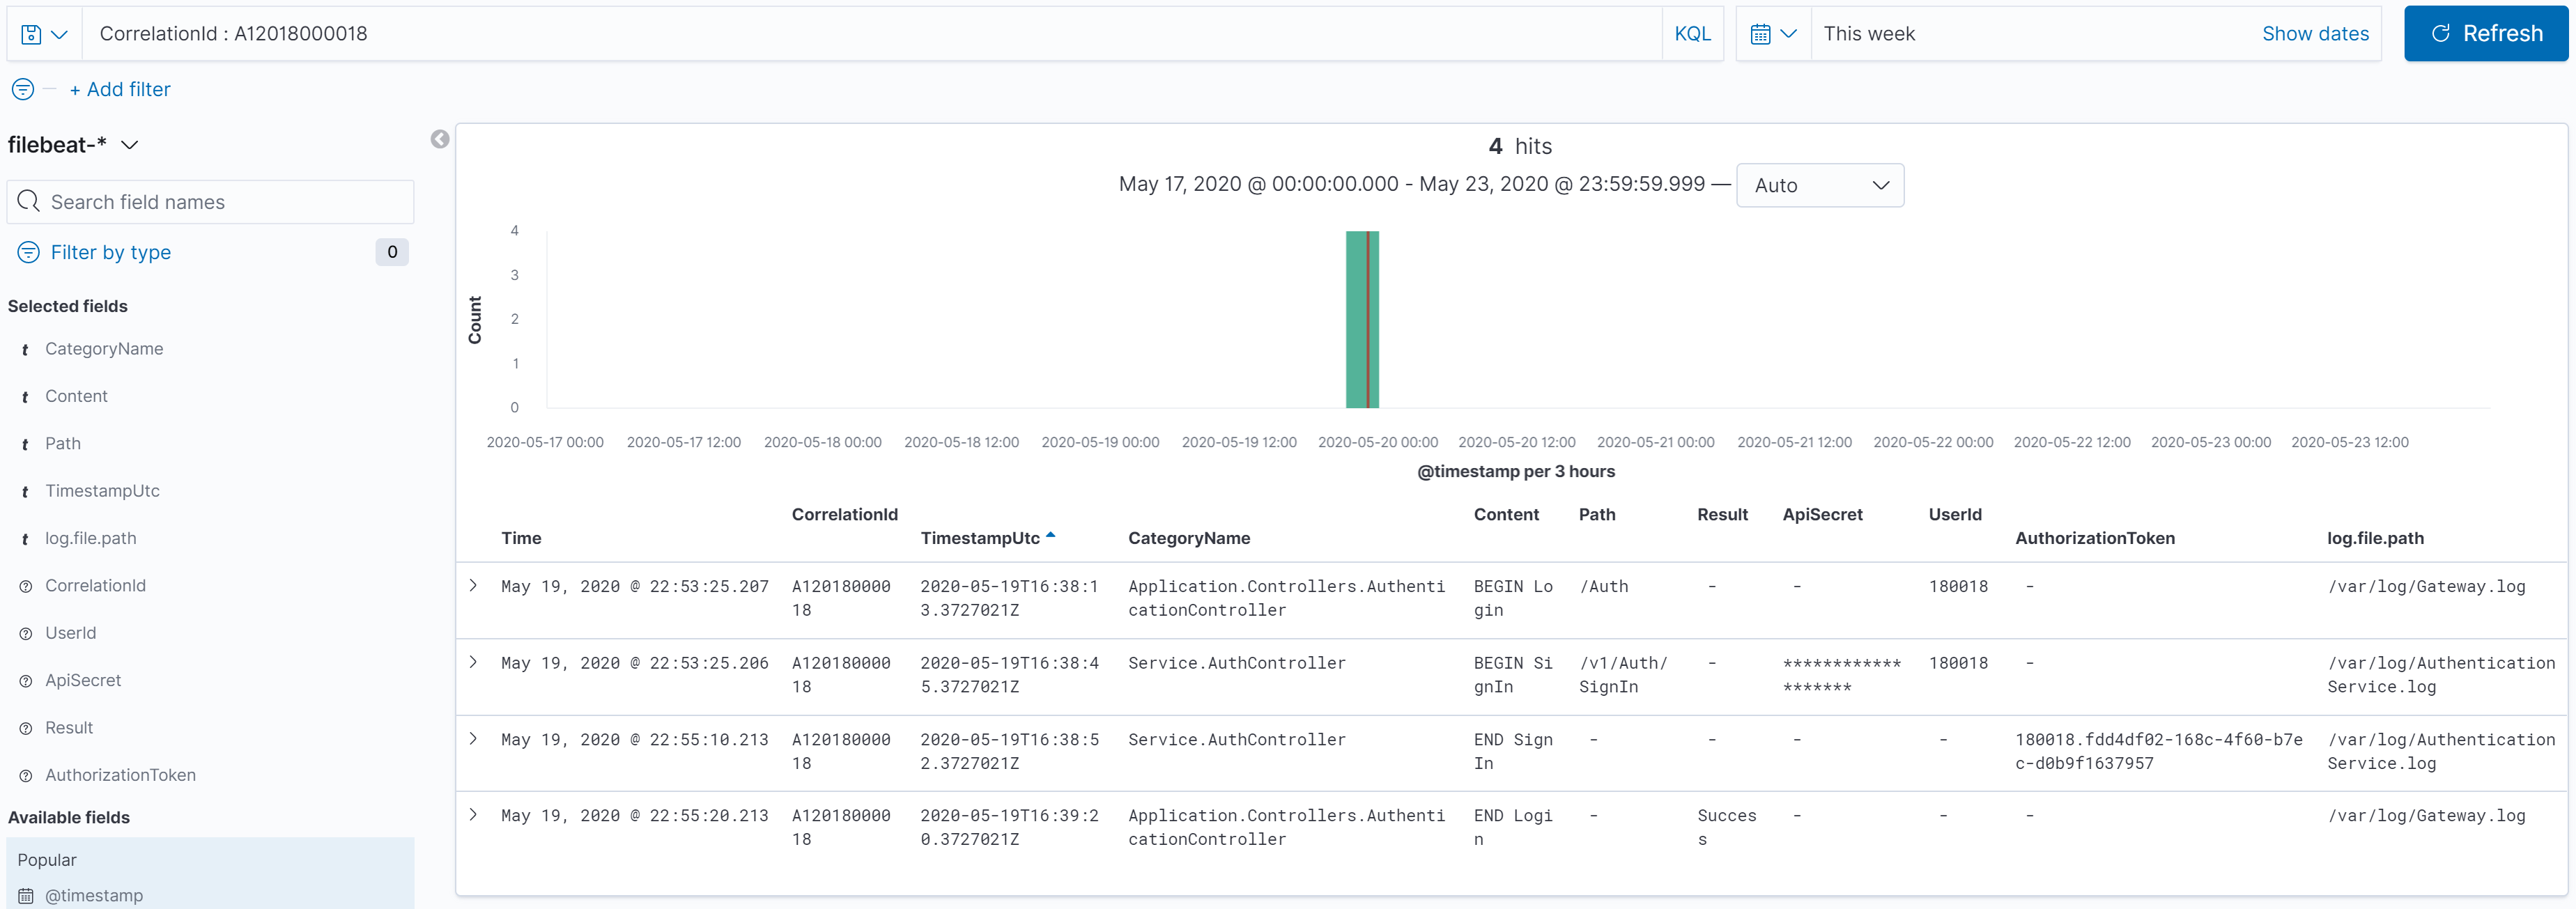
In that picture I searched for correlation ID: CorrelationId : A12018000018. What we see in the results are all the messages for that request, which in this case were spread over two different log files, potentially sourced from different servers, as it made its way through the system like a ball through a Plinko board.
Next time we’ll look at what value Open Telemetry can add to the mix as we continue along on our quest to understand what’s going on in our systems.