Part of the series: Fun with OpenTelemetry .NET
I’m working with a team that is doing something interesting I haven’t seen before.
They use this Google/Edge browser extension call ModHeader to tell their browsers to send a custom header called X-Debug-Trace when it makes requests to our application. What this header does is turn on a “Debug Trace Output” middleware which writes a bunch of details into the final markup:
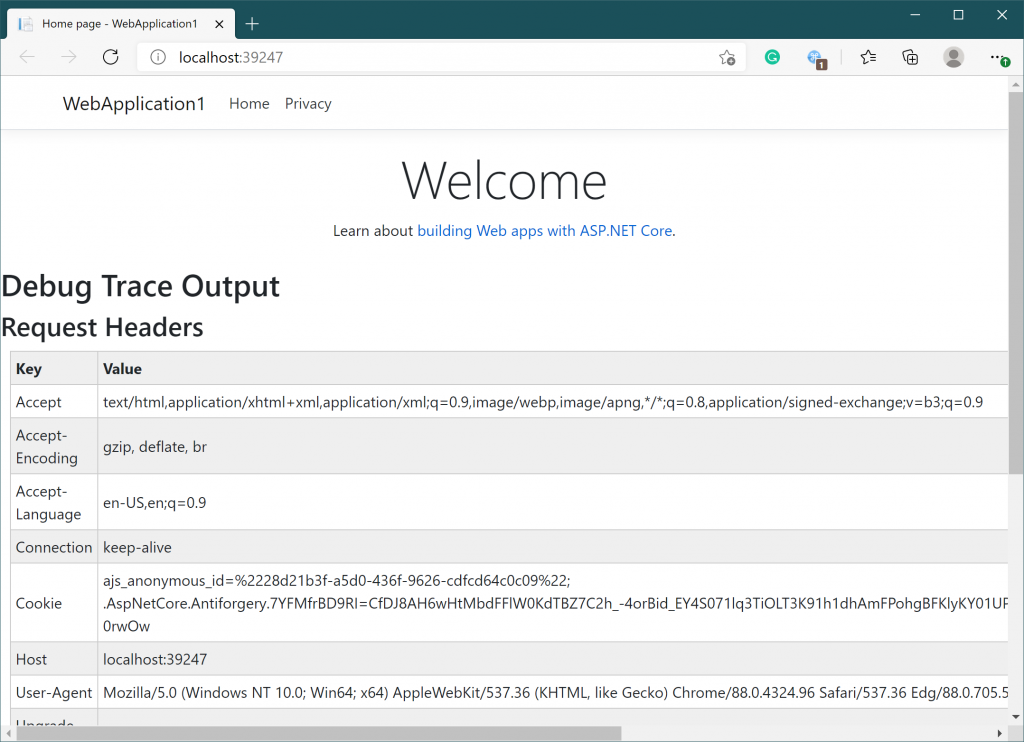
This is a simplified version that only shows request details, but they are using it to display a bunch of application-specific stuff as well as identity claims. There are also some other pre-conditions and rules before it will show, but the header is the main driver to turn it on.
The middleware works a little like this:
internal class DebugMiddleware
{
	private readonly RequestDelegate _Next;

	public DebugMiddleware(RequestDelegate next)
	{
		_Next = next ?? throw new ArgumentNullException(nameof(next));
	}

	public async Task InvokeAsync(HttpContext context)
	{
		HttpRequest request = context.Request;

		bool isTraceEnabledForRequest = request.Headers.TryGetValue("X-Debug-Trace", out StringValues DebugTraceEnabledStringValue)
			&& bool.TryParse(DebugTraceEnabledStringValue, out bool DebugTraceEnabled)
			&& DebugTraceEnabled;

		try
		{
			await _Next(context).ConfigureAwait(false);
		}
		finally
		{
			if (isTraceEnabledForRequest)
			{
				HttpResponse response = context.Response;

				await response.WriteAsync("<div id=\"DebugTraceOutput\"><h2>Debug Trace Output</h2>").ConfigureAwait(false);

				await response.WriteAsync("<h3>Request Headers</h3>").ConfigureAwait(false);

				await response.WriteAsync("<table><tr><th>Key</th><th>Value</th></tr>").ConfigureAwait(false);

				foreach (KeyValuePair<string, StringValues> header in request.Headers)
				{
					await response.WriteAsync($"<tr><td>{header.Key}</td><td>{header.Value}</td></tr>").ConfigureAwait(false);
				}

				await response.WriteAsync("</table>").ConfigureAwait(false);

				await response.WriteAsync("</div>").ConfigureAwait(false);
			}
		}
	}
}
The team loves this feature and uses it a lot so it didn’t surprise me when one of the developers asked me if we could add in details from the OpenTelemetry trace.
Interesting idea! But also a challenge…
OpenTelemetry .NET is built on top of a couple of things provided by the .NET Runtime in the System.Diagnostics.DiagnosticSource package.
- Activity: A Span in the OpenTelemetry spec. A given trace can have many of these.
- ActivitySource: The new way to start an
Activity. OpenTelemetry can listen for these out of the box! Use this if you ever want to push data into your traces. There are a bunch of other ways, too, like DiagnosticSource (which is probably the most common), but those have to be adapted to work. - ActivityListener: The new way to listen for
Activityobjects as they are created and the spot to apply sampling logic. This is where the OpenTelemetry is hooked in.
The natural thinking given that list would be to create an ActivityListener but the challenge we need to overcome is that listener will receive all the Activity objects created in the process and we just want the ones for the current request (a specific trace).
So how do we focus in on just the data we want to display?
The first need-to-know thing here is that OpenTelemetry uses this W3C Trace Context spec to define traces. There are two headers: traceparent & tracestate. Traceparent contains the trace identification. Tracestate contains extra data that will propagate along with the trace throughout the systems it flows through.
Traceparent is broken into three components: TraceId, SpanId, & TraceFlags.
For a given trace, TraceId will be the same across all Spans. SpanId will change for each thing that happens inside that trace (http call, database call, etc.). TraceFlags (at the moment) basically only tracks the sampling decision.
In .NET Activity exposes the OpenTelemetry Span API and the good news for our project is that Activity has all of these fields exposed as properties we can inspect.
The second need-to-know thing is that ASP.NET Core will automatically start an Activity before it starts executing middleware. So when our middleware fires Activity.Current.TraceId will have the current trace. When that Activity is started ASP.NET Core will look for traceparent on the incoming message. If it finds it, the trace will be restored. If it doesn’t find one, it will generate a new TraceId. The first Span in a trace we call the root. A root can be local or remote, but that isn’t too important here.
Putting it all together we need to listen for Activity objects using an ActivityListener but only for the TraceId of the Activity.Current created by .NET (or OpenTelemetry in some cases).
Design Considerations
There’s a couple things this listener should do.
- Turn on data collection if a trace was not sampled. Otherwise, there will be no data to show.
- Since #1 is expensive, we only want to do this when the tool is being used. When not in use, it should add no overhead.
Let’s create a method that will register a listener for a given trace:
public IActivityTraceListener RegisterTraceListener(ActivityTraceId traceId)
{
	TraceListener listener = new TraceListener(this, traceId);
	return !_TraceListeners.TryAdd(traceId, listener)
		? throw new InvalidOperationException($"A trace listener for TraceId {traceId} is already registered.")
		: listener;
}
It practically writes itself. We need to pass in a TraceId and we need to keep track of it. We need some way to cancel/destroy/remove the listener, so we need to return something. That something will need to expose the records we capture.
Let’s put together that interface:
public interface IActivityTraceListener : IDisposable
{
	IReadOnlyList<Activity> CompletedActivities { get; }
}
I chose to go with the Dispose call to clean up the listener. I like that pattern a lot for this type of thing because static analysis will often nag developers if they don’t dispose of something that is marked as IDisposable. Less of a chance they will forget to do it, basically.
Now we need to set up our listener:
// Watch out doing this in prod, it's expensive.
_ActivityListener = new ActivityListener
{
	ShouldListenTo = source => true, // Listens to all sources.
	Sample = (ref ActivityCreationOptions<ActivityContext> options) => ActivitySamplingResult.AllData, // Causes all Activity objects to be created and populated.
	ActivityStopped = OnActivityStopped
};
ActivitySource.AddActivityListener(_ActivityListener);
And in our OnActivityStopped we just need to match the Activity to its trace:
private void OnActivityStopped(Activity activity)
{
	if (_TraceListeners.TryGetValue(activity.TraceId, out TraceListener? listener))
		listener.Add(activity);
}
The other thing we need to build is the cleanup. That is going to be a lot more code so check out the link below to see how it works.
Final code
Introducing: ActivityTraceListenerManager
Available in Macross.OpenTelemetry.Extensions.
Shall we modify our middleware to take advantage of this?
internal class DebugMiddleware
{
	private readonly RequestDelegate _Next;
	private readonly ActivityTraceListenerManager _ActivityTraceListenerManager;

	public DebugMiddleware(RequestDelegate next, ActivityTraceListenerManager activityTraceListenerManager)
	{
		_Next = next ?? throw new ArgumentNullException(nameof(next));
		_ActivityTraceListenerManager = activityTraceListenerManager ?? throw new ArgumentNullException(nameof(activityTraceListenerManager));
	}

	public async Task InvokeAsync(HttpContext context)
	{
		HttpRequest request = context.Request;

		bool isTraceEnabledForRequest = request.Headers.TryGetValue("X-Debug-Trace", out StringValues DebugTraceEnabledStringValue)
			&& bool.TryParse(DebugTraceEnabledStringValue, out bool DebugTraceEnabled)
			&& DebugTraceEnabled;

		if (!isTraceEnabledForRequest)
		{
			await _Next(context).ConfigureAwait(false);
			return;
		}

		using IActivityTraceListener activityTelemetryTraceListener = _ActivityTraceListenerManager.RegisterTraceListener(Activity.Current);
		try
		{
			await _Next(context).ConfigureAwait(false);
		}
		finally
		{
			HttpResponse response = context.Response;

			await response.WriteAsync("<div id=\"DebugTraceOutput\"><h2>Debug Trace Output</h2>").ConfigureAwait(false);

			Activity activity = Activity.Current;
			if (activity != null)
			{
				await response.WriteAsync($"<p>TraceId: {activity.TraceId}</p>").ConfigureAwait(false);
			}

			await response.WriteAsync("<h3>Request Headers</h3>").ConfigureAwait(false);

			await response.WriteAsync("<table><tr><th>Key</th><th>Value</th></tr>").ConfigureAwait(false);

			foreach (KeyValuePair<string, StringValues> header in request.Headers)
			{
				await response.WriteAsync($"<tr><td>{header.Key}</td><td>{header.Value}</td></tr>").ConfigureAwait(false);
			}

			await response.WriteAsync("</table>").ConfigureAwait(false);

			var completedActivities = activityTelemetryTraceListener.CompletedActivities;
			if (completedActivities.Count > 0)
			{
				await response.WriteAsync("<h3>Telemetry</h3>").ConfigureAwait(false);

				await response.WriteAsync("<table><tr><th>Name</th><th>Tags</th><th>Duration</th></tr>").ConfigureAwait(false);

				for (int i = completedActivities.Count - 1; i >= 0; i--)
				{
					activity = completedActivities[i];

					StringBuilder tags = new StringBuilder();
					foreach (KeyValuePair<string, object> tag in activity.TagObjects)
					{
						if (tags.Length > 0)
							tags.Append(", ");

						if (tag.Value is not Array array)
						{
							tags.Append($"{tag.Key}={tag.Value}");
							continue;
						}

						tags.Append($"{tag.Key}=[{string.Join(", ", array)}]");
					}

					await response.WriteAsync($"<tr><td>{activity.DisplayName}</td><td>{tags}</td><td>{activity.Duration}</td></tr>").ConfigureAwait(false);
				}

				await response.WriteAsync("</table>").ConfigureAwait(false);
			}

			await response.WriteAsync("</div>").ConfigureAwait(false);
		}
	}
}
It looks like this now:
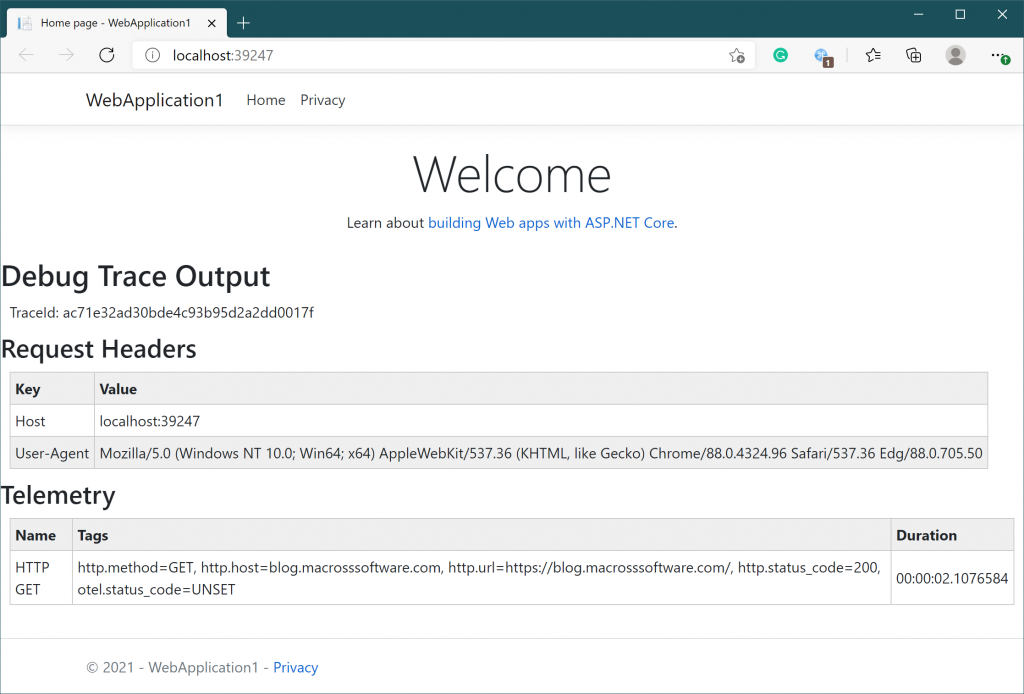
(I removed some of the request headers so it would show up nicely.)
Of course, it’s bugged
I ran into an issue testing this stuff. Above I mentioned there are other ways to create & start an Activity besides ActivitySource and those need to be adapted. Well it turns out the adapter in OpenTelemetry .NET doesn’t play very nicely with ActivityListener. So if you are using OpenTelemetry, and you are sampling, and you happen to use one of those sources, this might not work totally for you. For example, outgoing HttpClient instrumentation uses DiagnosticSource. What will happen if your run into the issue is your Span will show up in the debug output, it just won’t have any tags (if the sampler decided to ignore it).
I opened a PR to try and get this quirk resolved inside the adapter. But the fix involved creating the mother of all DynamicMethods so it might not get through review and into the library.
Update: Re-designed to work for all spans
The PR linked above didn’t get into the library. It used a pretty big dynamic method, aka a hack, so I’m not surprised. ActivitySourceAdapter class was later removed from OpenTelemetry .NET SDK so it wouldn’t have really mattered anyway.
I’ve discussed this issue with the OpenTelemetry team and the dotnet/runtime team (somewhat). I think this should be fixed in System.Diagnostics.DiagnosticSource because what we were trying to do in .NET 5 was build the OpenTelemetry tracing/sampling APIs into dotnet/runtime. But there’s no way to sample all Activity objects in the .NET code so we’ve had to do a bunch of work in OpenTelemetry .NET SDK to get around that. The end result is you need an SDK dependency if you want to participate fully in sampling. dotnet/runtime might be open to fixing it, but they are working on metrics for .NET 6 and that is more important.
For the moment, we’ll just need to live with the SDK dependency so the package has been updated. Instead of using ActivityListener it now uses OpenTelemetry .NET SDK Sampler. Here’s how that looks:
	internal sealed class ActivityTraceListenerSampler : Sampler
	{
		private readonly Sampler _InnerSampler;

		internal ActivityTraceListenerManager? ActivityTraceListenerManager { get; set; }

		public ActivityTraceListenerSampler(Sampler innerSampler)
		{
			_InnerSampler = innerSampler ?? throw new ArgumentNullException(nameof(innerSampler));
		}

		public override SamplingResult ShouldSample(in SamplingParameters samplingParameters)
		{
			ActivityTraceListenerManager? activityTraceListenerManager = ActivityTraceListenerManager;
			return activityTraceListenerManager != null
				&& activityTraceListenerManager.IsTraceIdRegistered(samplingParameters.TraceId)
				? new SamplingResult(SamplingDecision.RecordAndSample)
				: _InnerSampler.ShouldSample(samplingParameters);
		}
	}
That sampler has to be registered when OpenTelemetry TracerProviderBuilder is being configured. I added an extension (SetActivityTraceListenerSampler) for that. Everything else works the same!